Data collection and edge computing: utilize your data in the industrial and energy sector.
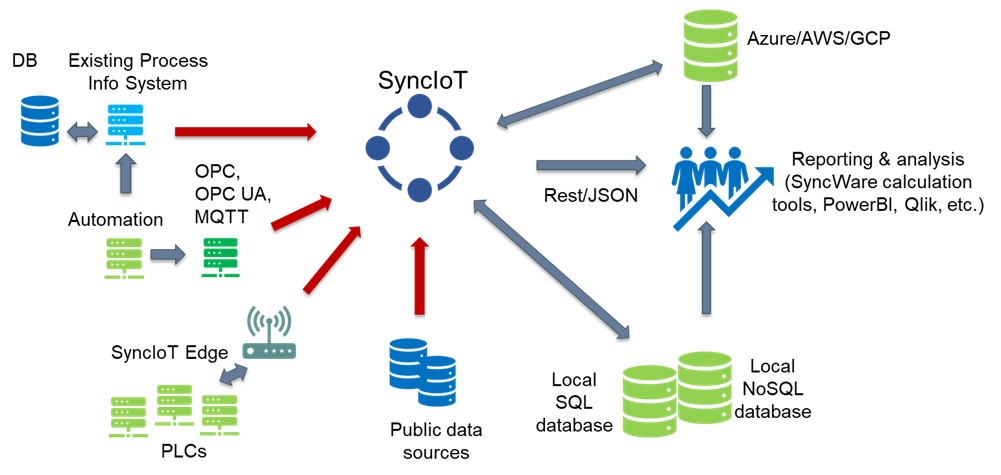
SyncIoT® is a software solution for data collection and edge computing for industrial process data. It is scalable from managing individual measurement object to an enterprise-wide solution.
SyncIoT® enables reliable data collection utilizing buffers. Our SaaS service solution provides an easy way to carry out industrial data collection of large data sets. SyncIoT® minimizes the total cost of data collection, storage and use. In our view, your business and process data belong to You. When you want to utilize your data, you often have to pay extra for its transfer, even though the data has already been collected. SyncIoT® helps you avoid this extra cost.
SyncIoT® is a ready-made NoSQL technology solution. With a NoSQL solution, you can collect and save all mill measurements with source system resolution and timestamps.
Special attention has been paid to secure data collection and transfer. The system also buffers data and after a connection is restored, continues in determined order.
SyncIoT® is…

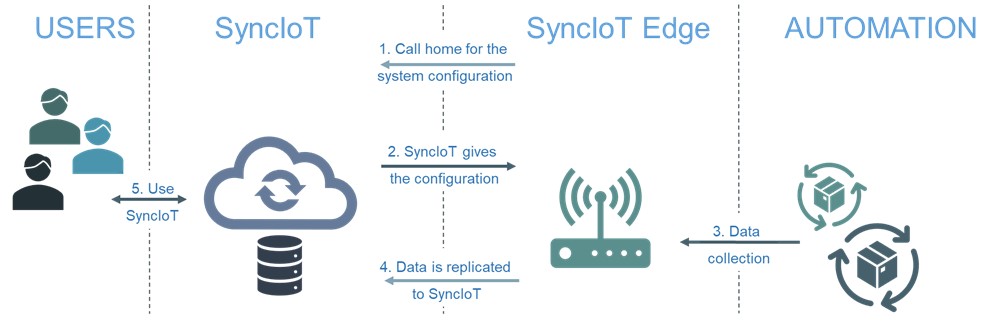
The SyncIoT Edge (a.ka. SyncMinion) computing module, which is an option in the SyncIoT® solution, offers a modern and easy way to reap the benefits of edge computing.
With SyncIoT Edge, you can carry out data preprocessing and reduction, and avoid unnecessary data storage and transfer. SyncIoT Edge also enables data collection from challenging data collection points – even beyond the reach of Ethernet. Extremely easy configuration of remote data collection is one of SyncIoT Edge’s strengths.

The system calls home and configures itself. No need for a local user interface.
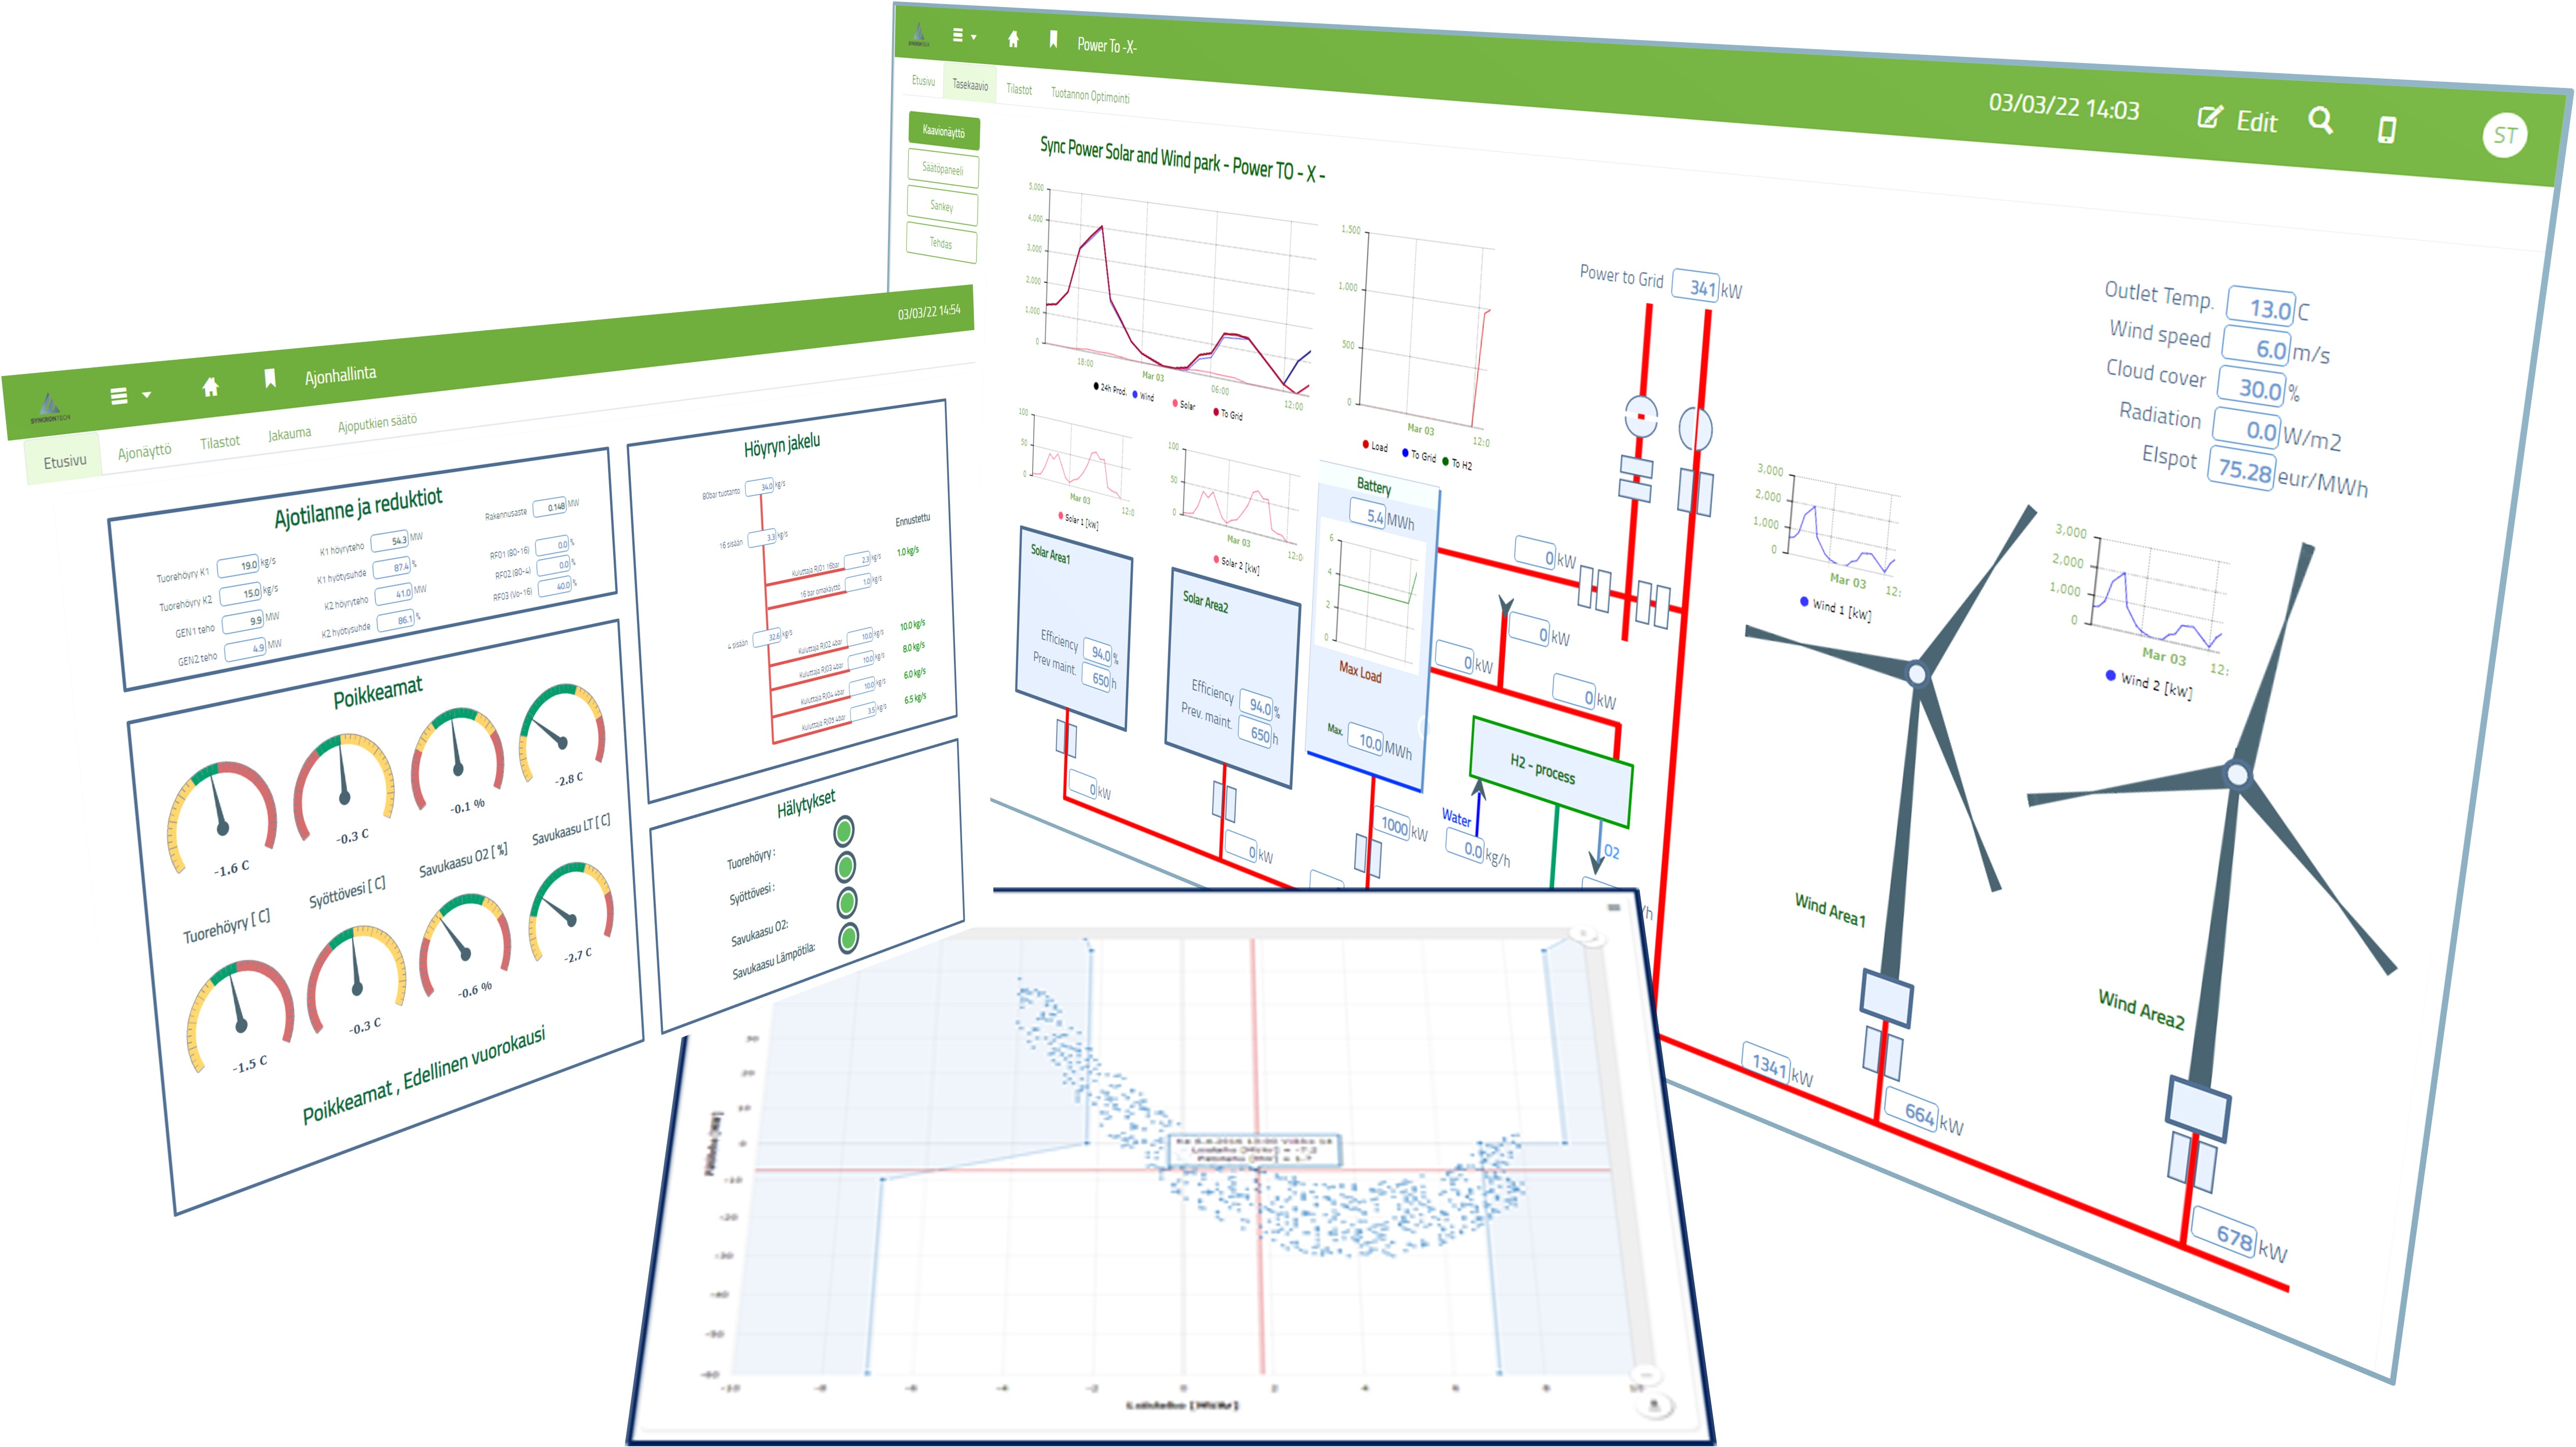
The collected process data turns into useful information by presenting it in a right way and in a right connection. Syncron Tech’s for all software modules common efficient reporting tools ReportWizard and SmartReport (ad-hoc reporting) are available, as well as calculation tool CalcWizard with its hundreds of readymade calculation functions. SyncViz process display tool can be used to visualize for daily use a factory or workplace layout added with necessary KPI’s, trends and reports.
If a factory or company level reporting is standardized to be done with a third party commercial product, that is also easily supported. Process data can be fetched with a number of interface protocols. Our customers have had strong preference on using JSON Rest API interface.
Examples of process data visualization

Copyright © Syncron Tech Oy 2023. All rights reserved. Privacy policy and Cookie policy. Cookie Settings.